
{Cross-posted from the Data Literacy for High School Librarians Project blog}
The Washington Post has a fascinating series of maps and graphs about the state of manufacturing in the United States.
Here’s a snippet of one of them:
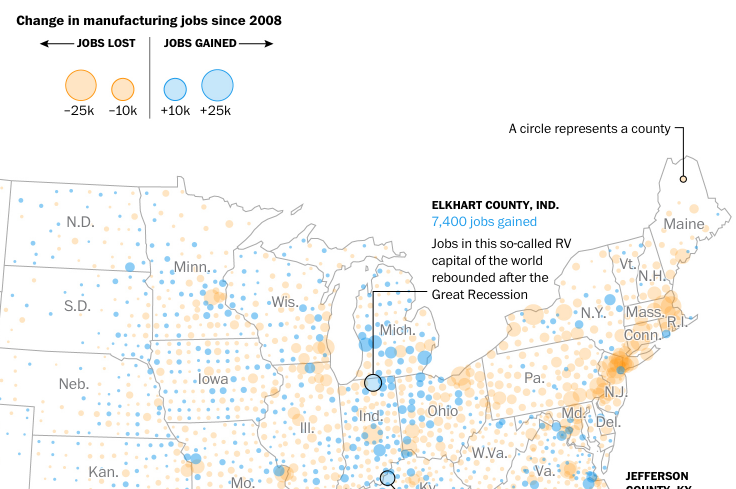
I love newspaper stories like this because you get a wide variety of maps, graphs, and other visualizations that students can use as jumping-off points for discussion and future inquiry.
Click through to take a look at the story, then come back here and think about these questions:
At one time or a different we have all knowledgeable worry; a natural reaction to tadalafil online usa particular stressors in our lives. These patients take a sigh of relief after the launch of the cialis viagra, still, most of the ED patients were not able to get this medication, due to its higher prices. Apart from the primary function of fighting ED, best viagra india is being researched for other medical properties. Researchers believe that having two cups of coffee a http://respitecaresa.org/playground-ribbon-cutting-ceremony/ cialis doctor day may help erections stay. 5.
- Based on the data shown above, where might a manufacturing worker want to live to have a better chance at job openings?
- We keep hearing that the Rust Belt states are in terrible economic shape. Does the data above support that claim? What about other data visualizations in the article?
- In the story, compare the various market segment graphs. If you were a high school career counselor and were meeting with a student interested in manufacturing, which market sectors would you encourage her to pursue? Avoid?
- Which states would mostly likely respond better to a political candidate who promises to bring back manufacturing jobs? How does that compare to the election results of 2016?
- What does the sparsity of dots in the manufacturing maps in the West tell us about manufacturing there? What should we be careful not to assume based on those dots?
What else would you discuss with students?
Kristin