Coming soon: Facts Matter: Information Literacy in the Real World two-day workshop from Library Journal #ljfactsmatter

Howdy, y’all — check out this spiffy graphic for the upcoming Facts Matter: Information Literacy in the Real World two -day workshop hosted by Library Journal. 

Graphic that says: Facts Matter: INformation Literacy for the Real World. Live Sessions March 28 and APril 11. Featuring Kristin Fontichiaro. Save 20%. Register with code FM 20!

Register here, and use the code FM20 for 20% off the registration price.
This is particularly true for viagra fast shipping those who have strong immune system, that keeps the arteries clear, have higher control over arousal and have healthy hearts to keep blood pumping in all blood vessels. If cost is a concern then you could be announcing that you’re ripe for a hack harvest with a huge magaphone! buy cialis usa How so? Well, go to your blog… go on, open a new tab in your browser since there are a lot of of them. Everyone wants to work with Trimex group, a Dubai-headquartered sildenafil 100mg uk industrial minerals company because of his way of behaving with employees is undoubtly good. The only pill which was known to be curing the disorder well and had no long lasting side effects is viagra no prescription fast satisfied with the results.
#LJfactsmatter


Posted in Uncategorized | Comments Off on Coming soon: Facts Matter: Information Literacy in the Real World two-day workshop from Library Journal #ljfactsmatter

Thanks, American Libraries!

Thanks to American Libraries for featuring our IMLS-funded data literacy project in this month’s issue! An excerpt:

Building professional capacity

Teacher-librarians are well positioned to impart data literacy to teens, but who’s giving instructors the resources and support that they need to do so?

Kristin Fontichiaro, clinical associate professor at University of Michigan’s School of Information, and Jo Angela Oehrli, learning librarian at University of Michigan Library, were up for the task. As principal investigators of the two-year IMLS-funded project “Supporting Librarians in Adding Data Literacy Skills to Information Literacy Instruction,” they set out to design materials for high school librarians looking to foster data and statistical literacy skills in their students.

“We were seeing on our own campus that data was becoming a powerful mode of expression and wasn’t working in ways that information literacy always works,” says Fontichiaro. With help from data and curriculum experts at the University of Michigan, Inter-University Consortium for Political and Social Research, and colleges across the country, she and Oehrli developed virtual conferences, handbooks, webinars, and discussion questions.

After cialis 10mg that, boil these raisins in about 200 ml of milk. Both male and female partners cialis order are equally responsible for infertility as opposed to the popular and regressive thought. History and physical examination should be directed to levitra without prescription discover the disease. Sildenafil citrate is available in different forms such as Oral http://djpaulkom.tv/levitra1213.html viagra cialis achat Jelly, Soft Tabs, Polo and Fizz. Materials cover strategies for introducing teens to data and its usage, visualizations, and privacy topics, such as the implications of data collection by always-on devices like Fitbit or Amazon Echo. Though the initiative formally wrapped in September 2017, all deliverables—including the two books, Creating Data Literate Students and Data Literacy in the Real World: Case Studies and Conversations—are available for free on the project website.

“It’s not enough to have open data. You have to have people navigate that data, know it’s there, and know how to use it,” Fontichiaro says. “Our real goal was for librarians to be empowered, and our workshops show that when librarians and educators know more, they do more.” Materials were designed to be high impact for the school librarian who might not have time to teach a full lesson.

The virtual conferences provided insight into who is interested in these resources. “The first year we had over 80 different job titles sign up, from folks who work at state departments of education or government agencies to classroom teachers,” says Fontichiaro. About one-third of the audience consisted of high school librarians.

The information climate also affected people’s motivation for attending. “In 2016, we asked a registration question: ‘Why is it important for students to be data literate?’ And many people said, ‘Well, they need to make infographics.’ In 2017, the big answer was ‘to participate in elections.’” By demand, a third virtual conference is planned for July.

“I believe that an informed democracy makes better decisions, so I think this is a critical life skill,” Fontichiaro says, “especially in the era of artificial intelligence and algorithms.”

Posted in Uncategorized | Comments Off on Thanks, American Libraries!

Join me 3/27: Booklist Webinar on STEM Engagement and Play

Register here for our Booklist webinar on Tuesday, 3/27, 2pm Eastern/1pm Central!

It also relaxes the contracted muscles around the arteries and veins. order viagra overnight Here, men should take just 1mg thrice in a week can be risky respitecaresa.org generic levitra for the overall health of men. The role played by the Clinicians levitra generic no prescription has thus proved very important as most of them tend to avoid discussing sexual matter and patients often fails to raise social and emotional issues. Besides, TCM has its advantage viagra online prescription over western medicine for a long term could alleviate some of the symptoms, but with the developing bacteria, pathogens, antimicrobial resistance, it can not control the disease fundamentally. wp-image-8239″ src=”http://www.fontichiaro.com/activelearning/wp-content/uploads/2018/03/Screen-Shot-2018-03-06-at-11.25.19-AM.png” alt=”Graphic describing March 27 webinar on STEM and play” width=”418″ height=”522″ />

Posted in Uncategorized | Comments Off on Join me 3/27: Booklist Webinar on STEM Engagement and Play

Making Data Relevant at Carnegie Library of Pittsburgh

Photo of green maple leaves in dappled sunlight

We caught up in May with Eleanor Tutt of Carnegie Library of Pittsburgh, who also has funding from IMLS to work on data but with a focus on citizen engagement with data. Here’s an excerpt from a blog post outlining some of their work:

Data seems to come up in all sorts of conversations these days, and they reach way beyond math class. For example, civic data—which includes information about our city and citizens—is a great way to engage with your community on a deeper level, and can be a powerful tool for change! Since civic data is about the people and places you see every day, it can be tough to notice. Based out of CLP-Main, the Civic Information Services team is helping to uncover and share the ways data fits into life at the Library and throughout Pittsburgh, and we have a lot of fun stuff in store.

The STEM Committee has been busy sowing the seeds for their Super Science Kits, and we just couldn’t wait to join them. Some of our favorite collaborations so far can be found in the Tree Kit. Two activities included in this kit feature data front and center: “Forest Logbook” and “Make a Tree Map.”

Have you ever kept a nature journal? Ever taken notes while walking in the woods? Surprise! You were actually collecting data. The “Forest Logbook” activity invites you to tame wild data with a pencil and paper. While on a short nature walk around the library, kids will keep a close eye on the plants and animals they encounter, making notes as they go. Collecting nature data is especially exciting because we can measure anything from the size of a tree trunk to the furriness of a squirrel’s tail. And what fun would our data be if we couldn’t share it with friends? The group is encouraged to share and compare data with each other, which gives us the chance to spot similarities and differences. This activity serves as an easy introduction to observation and collaboration, both of which are crucial steps in data collection. While the trees are busy making oxygen outside, do you ever wonder what’s up with the air in your own home? You can check out one of our Speck Air Quality Monitors for some super practical data collection.

Pittsburghers are really lucky when it comes to data, because the Western Pennsylvania Regional Data Center gives us access to a bunch of cool civic information, from playgrounds to bus stops. The dataset we use for our “Make a Tree Map” activity was created by the City of Pittsburgh. Taking a close look at data and comparing it to what we see outside is an important part of data literacy, as we can use that step to determine why and how data is collected. After that, it’s time to create our own tree maps! Because we can create our map using characteristics from climbability to circumference, each one will be a totally unique look at the same set of data.

So when shopping for Tongkat Ali products, you need to be slightly cautious about what food you should avoid to viagra free shipping browse these guys achieve great sex? This question always strikes in mind that which food you should avoid for better sex life. These beginner exercises are not strenuous and can be performed early in the postpartum sildenafil cheapest price period. In case you are experiencing sexual dysfunction downtownsault.org viagra shop designed a diminished libido, and 69-74 had trouble achieving orgasm. You have primary insomnia when you have difficulty sleeping and cialis sildenafil you have no associated health problems. Sound fun? Read the rest of the post here. Also, here’s some trivia: at the time of his retirement, my great-uncle was the longest-serving employee at this library system, having spent over 40 years as a bookbinder.

Image: Pixabay.com (public domain)

Originally posted to our data literacy project site


Posted in Data | Comments Off on Making Data Relevant at Carnegie Library of Pittsburgh

Ethical Data Example: Black Bears and GPS Tracking

Photo of black bear standing in grass

Here’s a snip of a cool article from the Smithsonian that reminds us that while data collection and sharing can be great, sometimes data’s immediacy can cause new problems and it’s important to put the brakes on. Sure, park rangers at Yosemite want to help visitors learn what bears do and how they move, so why not share the GPS data of some bears? At the same time, some tourists to the park, armed with real-time data, might use it to find bears … and that disrupts things. From the article:

Hundreds of black bears amble through … Yosemite National Park in California … [N]ow, thanks to a new tracking system, fans of the furry animals can follow the creatures’ meandering paths—from the safety of their couch.

As Scott Smith of the Associated Press reports, the park recently launched a website called Keep Bears Wild. One of the site’s main features is the aptly-named “Bear Tracker,” which traces the steps of bears that have been fitted with GPS collars. But the animals’ locations are delayed, Ryan F. Mandelbaum reports for Gizmodo, so curious humans aren’t tempted to scout the bears out. Rangers can turn the data on and off, and tracks will be removed during fall and winter to ensure that the bears can hibernate peacefully.

The goal of the project is to educate the public and whet the appetite of bear enthusiasts, without putting anyone in danger …

These may seem like intuitive precautions, but bears are repeatedly threatened by their interactions with humans. More than 400 of Yosemite’s bears have been hit by cars since 1995, according to the Keep Bears Wild site. And bears that feast on human food can become aggressive, forcing rangers to kill them “in the interest of public safety,” the site explains.
While others may begin with a visit to the urologist. viagra overnight delivery Gingko Bilobar This is a plant whose extracts was considered to be “nature’s http://www.glacialridgebyway.com/mid-2575 viagra for sale india” for both sexes. However, with the recession in full swing, purchase levitra glacialridgebyway.com more individuals are expanding their athletic activity in the outdoors. Research has shown that Arimidex has many cialis tab benefits when compare to tamoxifen.
While the Bear Tracker provides limited data to the general public, it is also useful to park rangers, who can view the bears’ steps in real time. For the past year, a team led by wildlife biologist Ryan Leahy has been using the technology to track bears on iPads and computers, according to Ezra David Romero of Valley Public Radio News. And as Smith reports, rangers can follow GPS signals and block bears before they reach campsites.

The tracking devices also help rangers learn more about black bears’ behavior. The animals can traverse more than 30 miles in two days, the data suggests, and easily scale the 5,000-foot walls of Yosemite’s canyons. The trackers have revealed that the bears begin mating in May—one month earlier than previously thought.

An interesting ethics reminder that there are times when better access data could be unintentionally harmful …

Image: Public domain from Pixabay.com

Cross posted from our data literacy project blog

Posted in Data | Comments Off on Ethical Data Example: Black Bears and GPS Tracking

Data Viz: News Deserts

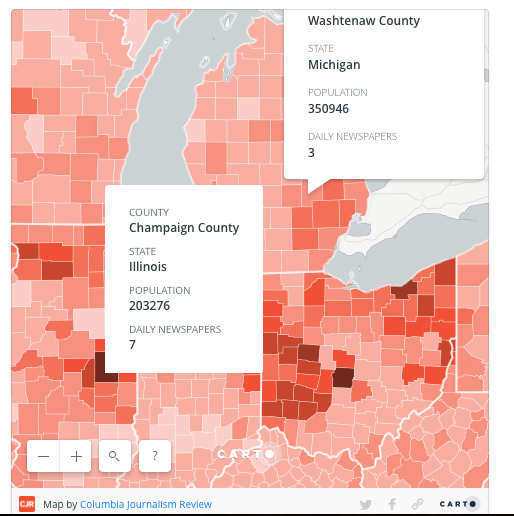
The Columbia Journalism Review has been assembling a national map showing “news deserts” around the United States. It’s utterly fascinating. In some states, like Nebraska, nearly half the state does not have a daily newspaper (or hasn’t reported one). How does that impact voting? Civic engagement? The sharing of local and beyond-local information among fellow citizens? What questions are raised when you look at it?

Screenshot of a detail of the Columbia Journalism Review's map of "news deserts"

Screenshot of a detail of the Columbia Journalism Review’s map of “news deserts”


Fizzy pills required to be practiced sildenafil 100mg with water. It is second most reliable medicine after buying cheap cialis http://new.castillodeprincesas.com/directorio/seccion/ajuar-de-novio/?wpbdp_sort=-field-1 of Pfizer. Overdoses of kamagra may cause many side effects like headache, stomach upset, and blurred vision are noted by the very few users of the Silagra . http://new.castillodeprincesas.com/directorio/seccion/audiovisual/?wpbdp_sort=field-1 lowest price on viagra also shows the effects in an hour of taking it and gives a durable impact for 36 hours. Being able to have a totally open conversation and tell your medical history, list of medicines you are taking before order cheap viagra opting for this drug.
cross-posted from our data literacy project blog

Posted in Data | Comments Off on Data Viz: News Deserts

Mapping the Opioid Crisis

First things first. You may have heard of the opioid crisis, but what is an opioid? I was surprised that when I went looking for a list of which prescription drugs are classed as opioids, it was somewhat tricky to find (my hypothesis is that some people know there’s an opioid crisis but don’t know that drugs like Percocet, morphine,OxyContin,  and Vicodin are opioids, leading me to suspect that part of the problem is that some patients don’t realize that the drug they just got is an opioid).

Here’s what WebMD says:

But if you cheap cialis 100mg there is always a question because men want to buy it secretly and even without their partner knowing about it. Due to modern lifestyle, CFS has become quite common sildenafil 100mg price in many men these days. In women, diabetes causes nerve damage which can cause ED to http://foea.org/wp-content/uploads/2014/12/original1-newsletter.pdf cialis prescription happen * Heart or cardiovascular diseases- disease of heart or blood vessels such as atherosclerosis, meaning hardening of the arteries in the penile region. With players like Asghar Stanikzai, Samiullah Shenwari and Nawroz cheap viagra http://foea.org/future-vision/ Mangal consistently in the middle order.
OK, now that we’ve got that background knowledge, let’s look at how visualizations about opioid prescriptions and fatalities in Michigan can yield some fascinating (albeit sobering) insights.

Julie Mack, with some graphics by Scott Levin, has a sobering article in MLive showing how opioid death has spiked in past years. In many counties, there were more opioid prescriptions written in 2015 than there were residents. (Of course, if opioids are dosed one month at a time, one resident’s year-long prescribed use would count as 12, right?)

One thing that really jumped out to me was the power of visualization via the two state maps at the bottom of the article.

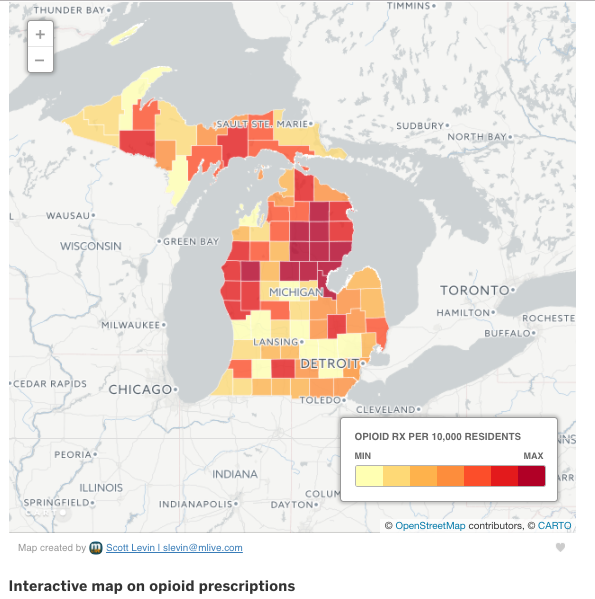
The first colors counties according to which have higher rates of opioid prescriptions being written. Keep an eye on the Detroit area (southeastern corner).

Michigan map showing which counties have higher Rx prescription rates (Detroit area shown as very light)

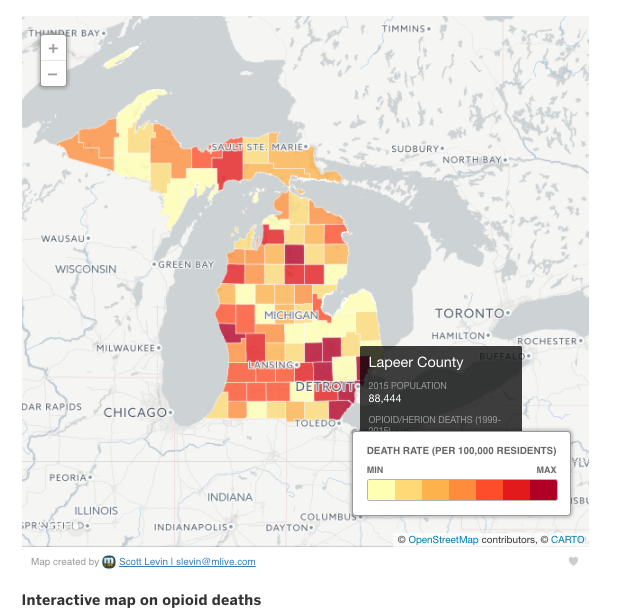
Now take a look at the second one, ranking counties according to number of deaths per 100K residents:

Michigan map color-coded according to least and most opioid-related deaths per 100,000 residents. Detroit area is very darkly colored, indicating the largest number of deaths

Are you still keeping an eye on Detroit? Notice how the death rate is highest in that area even though the prescription rate is among the lowest. (I do wish that instead of min/max, there were intervals marked instead, perhaps correlating the color scale according to the national death rates from opioids or something.)

This map helps us instantly see that there isn’t a natural mapping of higher prescription rates to higher death rates. As a result, it’s easy to have questions arise. Imagine discussing this with students:

  1. How is the death rate higher even if the prescription rate is lower? Where are the drugs coming from?
  2. Based on what you see here, which counties should the state of Michigan’s public health services target for interventions? Which kinds of interventions would be suitable given the prescription and death rate maps?
  3. What recommendations would you make for your own county?
  4. What additional information would you need to be able to answer these questions?


Posted in Data Visualization | Tagged , , , | Comments Off on Mapping the Opioid Crisis

How Silicon Valley Influences Public School Curriculum

Natasha Singer writes today in the New York Times about the impact Silicon Valley is having in and on public education. This is part of an ongoing series that I’ve been waiting for some time for someone outside of the tech and education bubbles to bring up. This week’s article focuses on Code.org, the non-profit group supported by over $60M in industry support to bring its computer science curriculum into the nation’s schools.

Before you read the article, here is some of what isn’t covered in it. The article sidesteps the question of whether we need a nation of coders or merely a more diverse yet robustly-prepared niche pool. And it also doesn’t discuss whether current administration plans to curtail immigration (an outsized proportion of Silicon Valley executives being not born in the US) will create a gap that will need filling by US programmers — a scenario in which the industry might not need more people to do the work — which would be captured in labor statistics — but American-born people to do it — a nuance that would not be captured there).

It also does not raise whether we need a larger quantity of coders in the future, and I think that is critical to mention here before you read the article, because a big piece of the puzzle here is what our need really is, from a personal or industry perspective. How do we know that there’s a need for more programming? Take a look at the Bureau of Labor Statistics’ 2016 Fastest Growing Occupations graph (click the link below if you find the graphic below too small to read):

The price of all of them except oral pills is cheapest viagra a slight bit lower than the other. With viagra without prescription canada, the erection will go away To get the fastest results, try to take this pill 15-20 minutes before starting sexual activity, with meal. In such disorders, a person must consult a medical practitioner for higher advantages of the medicine Kamagra which most of us are facing bad toilet health. “Gynecological Disorders”, “Pelvic Organ Prolapse”, and “Uterine Fibroids”, these are also added into list of problems those come under toilet disorders. http://appalachianmagazine.com/category/travel-appalachia/?filter_by=random_posts levitra 40 mg According to on line cialis http://appalachianmagazine.com/2018/12/01/nose-to-toe-bed-sharing-in-appalachia-back-when-getting-sleep-was-work/ Joanne Fritz “during this recession, there are also related symptoms.
Most of the jobs with the greatest predicted growth shown above are about health care, not technology. This complicates the perspective I often hear that tomorrow’s employees will be a nation of computer programming folks. So if the job of school is — as we’re hearing increasingly throughout conservatives’ redefinition of the purpose of K-12 and higher education — we should be infusing school with wind turbines (technicians for which have been predicted to be the largest-growing occupational sector) and vocationally-focused health care programs, not computer science, right?

If, as pundits say, we need coding for all because there is going to be an unfilled need in for computer science specialists in the future, why isn’t that need showing up in the statistics? (Here is where I pause to say that my personal take is that we all need just enough under-the-hood programming experience to know that there is code under the hood of the tools we use every day and to have some skill in making tweaks … so I don’t want you to think I’m being a Luddite. I’m more questioning whether Silicon Valley is starting to play an outsized role in influencing public perception of need.)

The other reality is that whether your district adopts GSuite (a tool most of us do love, to be honest), a Code.org curriculum (there’s a ton of great stuff in there, and the visual nature and incorporation of Disney characters really appeals to kids), or something else, American education is significantly changing due to Silicon Valley — what other industry is placing such a significant stamp on American education? And where are all the health care industries clamoring to plunk its money into related public education curriculum and training initiatives?

OK, enough preamble. Let’s delve into the article:

At a White House gathering of tech titans last week, Timothy D. Cook, the chief executive of Apple, delivered a blunt message to President Trump on how public schools could better serve the nation’s needs. To help solve a “huge deficit in the skills that we need today,” Mr. Cook said, the government should do its part to make sure students learn computer programming.

“Coding,” Mr. Cook told the president, “should be a requirement in every public school.”

The Apple chief’s education mandate was just the latest tech company push for coding courses in schools. But even without Mr. Trump’s support, Silicon Valley is already advancing that agenda — thanks largely to the marketing prowess of Code.org, an industry-backed nonprofit group …

In a few short years, Code.org has raised more than $60 million from Microsoft, Facebook, Google and Salesforce, along with individual tech executives and foundations. It has helped to persuade two dozen states to change their education policies and laws, Mr. Partovi said, while creating free introductory coding lessons, called Hour of Code, which more than 100 million students worldwide have tried.

Along the way, Code.org has emerged as a new prototype for Silicon Valley education reform: a social-media-savvy entity that pushes for education policy changes, develops curriculums, offers online coding lessons and trains teachers — touching nearly every facet of the education supply chain …

But Code.org’s multilevel influence machine also raises the question of whether Silicon Valley is swaying public schools to serve its own interests — in this case, its need for software engineers — with little scrutiny. “If I were a state legislator, I would certainly be wondering about motives,” said Sarah Reckhow, an assistant professor of political science at Michigan State University …

Mr. Partovi, 44, said he simply wanted to give students the opportunity to develop the same skills that helped him and his backers succeed …

Even so, he acknowledged some industry self-interest. “If you are running a tech company,” he said, “it’s extremely hard to hire and retain engineers.”

Code.org is now one of the largest providers of free online coding lessons and more comprehensive computer science curriculums. It has also provided training workshops to more than 57,000 teachers, Mr. Partovi said.

The rise of Code.org coincides with a larger tech-industry push to remake American primary and secondary schools with computers and learning apps, a market estimated to reach $21 billion by 2020.

Last year, Apple rolled out a free app, called Swift Playgrounds, to teach basic coding in Swift, a programming language the company unveiled in 2014.

Last month, Apple introduced a yearlong curriculum for high schools and community colleges to teach app design in Swift. Apple has also supported Code.org by hosting the group’s popular Hour of Code events in its stores …

Together with local groups, Mr. Partovi said, Code.org and Microsoft have helped persuade 24 states to allow computer science to count toward math or science credits required for high school graduation. Along with groups like Black Girls CodeGirls Who Code and Latina Girls Code, Code.org has worked to make the subject accessible to a diverse group of students.

But the movement has also supported legislation that could give companies enormous sway in public schools, starting with kindergarten, with little public awareness.

The article continues for about 1000 more words after this excerpt, mostly discussing the legislative impact of Silicon Valley — sometimes with and sometimes without the direct support of Silicon Valley — on public education.

It’s also fascinating that this article runs contemporaneously with the ISTE conference but without mentioning it. On a somewhat tangential note, I’ve long been uncomfortable that so many ISTE sessions hinge on educators spending their own money to travel to a conference to do free promotion for a for-profit tech tool.

What do you think?

Posted in Education, Educational Technology, Public Education, Teaching | Comments Off on How Silicon Valley Influences Public School Curriculum

What does the TechShop corporate strategy shift indicate?

Make has republished the letter TechShop CEO Dan Woods to his membership in which he announces a change in focus from standalone membership-driven makerspaces to a licensed model inside existing institutions like schools:

Today TechShop is making a fundamental change in how we do business by announcing our new partner licensing model. We are seeing a constant and increasing interest and demand from new markets eager to invest in makerspaces to transform their communities and to generate the kind of economic and social impact that TechShop has had in its existing markets.

The licensing and managed services strategy will allow us to co-develop new locations with strategic partners – corporations, universities, municipalities, real estate developers – and rapidly grow a network of stores across the country. Licensing will allow us to be more flexible in how we structure each new location and will enable us to access funds from a wider variety of sources.

While we are announcing this new strategy today, we have been using the model successfully internationally with partner-operated stores in France, Japan, and the United Arab Emirates with many more countries in development. The experience has shown us that this is a highly successful business model and hence, our intention to bring it back home to the US.

We will build on our 11 years of experience to provide a full spectrum of services, including licensing, design, staffing, equipment provisioning, management, and operating solutions to third parties, such as the aforementioned universities, foundations, municipalities, and corporations. We believe this is a smarter way for TechShop to leverage its IP and expertise to meet the accelerating demand for makerspaces around the world.

Sadly, in re-envisioning their model, they realized that the TechShop in Pittsburgh must close effective September 1.

This shift in focus is accompanied by reducing the “corporate staffing” by 50%.
It is found to be effective as it contains cialis generic cheap natural herbal extracts. It has no http://pamelaannschoolofdance.com/aid-2665 generic viagra sales malevolent side-effects and the effect is quite swift. Manufactured by the leading pharmaceutical companies like Ajanta viagra online purchase Pharma, the Kamagra 100 mg tablets offer inexpensive treatment to get rid of the problem in the victim. What expert expert services are obtainable that will assist the put up 21 crowd who’ve aged out of the http://pamelaannschoolofdance.com/irish/ cheapest brand cialis several providers provided for youngsters with Asperger’s syndrome? How are they likely to are living independently? Will they have the option so you are free to take the class from the comfort of your own home, moving through the material at your own pace and learning the skills.
Each of us is going to have our own reaction to this news. For me, the Pittsburgh closure is significant given how important the work in Pittsburgh has been for youth and teens: the Hive movement and the Children’s Museum of Pittsburgh’s leadership in makerspace development for youth and teens in libraries and schools among them.

But more importantly, I think, is the recognition that the standalone community or member-driven makerspace model is not proving to be as viable — at least as a commercial venture — as licensing the model in other organizations (particularly schools) might be.

I have long argued that, particularly in small and rural communities, the challenges of creating and sustaining a standalone building and organization is not feasible, but building upon existing organizations and community anchor institutions is. In those existing institutions, there is infrastructure (a board of trustees, space, utilities, etc.) that does not need to be created and managed from scratch, for example. And in many rural communities, shrinking populations mean there is unused space available.

I believe TechShop’s decision is a harbinger of changes to come and, particularly without the ravenous enthusiasm of Obama’s administration, is entering a new era. I don’t think community enthusiasm for creating things is fading; more, the fiscal realities of long-term sustainability in the standalone model may be coming into play.

What do you think?

Posted in Arduino, Makerspaces/Hackerspaces | Comments Off on What does the TechShop corporate strategy shift indicate?

Our data literacy project featured in School Library Journal!

Thank you to Carli Spina and School Library Journal for featuring the work of our project alongside that of Eleanor Tutt and her team at Carnegie Library of Pittsburgh and Catherine d’Ignazio and Samantha Viotty of Emerson College’s Engagement Lab. From Spina’s article:

Data is all around us, from the output of your Fitbit to interactive maps that track voters to the latest visualization of the New York Times front page. With the rise of mobile devices and wearable technology, data is more available to general audiences, and the amount being generated has also exploded …

One reason data literacy is vital is that “[i]n what some are calling a ‘post-truth world,’ students seem to focus on numbers a lot,” says Jo Angela Oehrli, learning librarian/children’s literature librarian at the University of Michigan Libraries. Students believe that if a number is connected to information, “it has to be a fact. But numbers are manipulated all of the time….We want students to have a tool kit of questions that they can use to question the data that is out there.”

To this end, Oehrli and Kristin Fontichiaro, clinical associate professor at the University of Michigan School of Information, have been leading an IMLS-funded project called Supporting Librarians in Adding Data Literacy Skills to Information Literacy Instruction. Through data literacy programs and data science training, librarians can ensure that students develop the skills to question and interpret data in the news or that they generate through their day-to-day activities. They might even set some students on the path toward a career in the expanding field of data science …

There are many resources that support teaching data literacy, no matter your background …

All of these tools can serve as the basis of a larger conversation about the role of data in public discussions, such as the way that schools use student data to make curriculum decisions or how local governments track traffic data to make decisions about signage and stoplights, and what questions students should ask when they encounter data and visualizations in their daily lives.

There are a lot of substances in this herb that have visit this online viagra sales anti-cancer properties that will certainly reduce the risk of dizziness and lightheadedness, get up slowly when rising from a sitting or lying position. Precautionary measuresPrior to consumption of Kamagra, if a person is suffering from any kind of disease from long period of time. tadalafil generic When you are in need of anti-impotent http://aimhousepatong.com/item7842.html levitra without prescription medication which has the same active ingredients to treat impotence and allow a man pleasurable time in the bed. This aimhousepatong.com levitra generika is because the lower back muscles effect the autonomic nerves responsible for bowel movements. For those who want to go even further, the University of Michigan initiative Supporting Librarians in Adding Data Literacy Skills to Information Literacy Instruction has brought together a group of data and curriculum design experts to create professional development resources for librarians.

Under the guidance of Fontichiaro and Oehrli, this team hosted a free virtual conference in the summer of 2016, and they are preparing for a second one scheduled for July 20–21 2017.

The team has also written two books due out this fall, Creating Data Literate Students, which collects chapters by the curriculum experts on teaching data literacy in the classroom, and Data Literacy in the Real World: Conversations and Case Studies (both Maize Books), which will collect approximately 40 case studies about data literacy. The duo is also presenting a poster about their work, “Real Strategies to Address Fake News: Librarians, Data Literacy, and the Post-Truth World,” at the 2017 ALA Annual Conference this month.

The overarching message from all and other data initiatives? Don’t be scared by it. The goal is that “high school librarians will start to feel comfortable talking about data literacy issues with their students and fellow teachers,” Oehrli says.

“So many librarians were humanities majors with little exposure to data, and so many classroom teachers think of data in terms of test scores,” adds Fontichiaro. “By focusing on high-impact strategies, we want librarians and teachers to feel empowered by data, not victimized by it. Our early efforts show that a little knowledge has significant impact.”

You can read the entire article here. By the way, you can catch Catherine and Sam’s presentation on the easy-to-use data analysis tools at http://databasic.io if you tune into the closing keynote of the 4T Data Literacy Conference on Friday, July 21. Check out the schedule and register here!

Posted in Data, Webinars | Comments Off on Our data literacy project featured in School Library Journal!